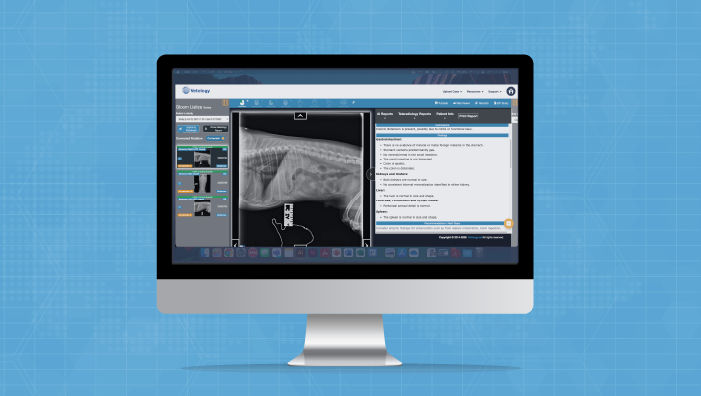

How to Use Vetology: 30 Days to a Smart, Practical AI Radiology Workflow 

How to Use Vetology: 30 Days to a Smart, Practical AI Radiology Workflow 

ARTICLE ABSTRACT

Vetology is a veterinary AI radiology platform that pairs automated AI screening of canine and feline radiographs with on-demand access to board-certified and board-eligible radiologists.

Key Takeaways:

  • Setup is fast. A single 45 – 60-minute remote call configures DICOM, account settings, and includes an initial training.
  • The platform works with all major digital X-ray brands and includes unlimited DICOM storage, a built-in PACS, and integrations with select PIMS and AI scribe platforms.
  • Radiographs auto-route to the AI screening tool, and reports return within minutes with findings, conclusions, and recommendations.
  • The recommended workflow is to read the radiographs first, then review the AI report as a structured second look.
  • Board-certified and board-eligible radiologists are available on demand, with STAT reads in two hours, routine reads in 24 hours.
  • Most clinics reach full workflow integration within days, but we continue to provide support with client services check-in at month one, and beyond.

Adding a new tool to any workflow can feel intimidating. But with Vetology’s fast veterinary AI implementation, validated AI screening software, and access to board-certified (and board-eligible) radiologists, you can be up and running in no time. 

Here’s what the first 30 days with Vetology look like, including the teleradiology setup process, veterinary DICOM integration, and team training and support.

Setup and Support

The Vetology support team remotely manages all aspects of setup. During a one-hour scheduled call, the support team will: 

  • Configure your account settings
  • Establish and test your DICOM connection
  • Troubleshoot installation issues
  • Provide initial training

The Vetology platform supports all brands of digital radiograph equipment, and your subscription includes unlimited, free DICOM storage and a built-in PACS (if you need one), this can eliminate the need for separate, expensive storage systems, however, changing your PACS is at your clinic’s discretion. Vetology also integrates with several PIMS and AI scribe platforms, giving clinics the option to submit visit notes to the platform alongside images.

Once the support team configures your hospital’s settings and enables the “auto-send” feature, all images captured on in-house equipment will route to Vetology’s AI screening tool, with the option to consult a board-certified or board-eligible radiologist. You can use the platform within an hour of installation.

Learning To Use The Vetology Platform

After a guided onboarding, day-to-day use is simple. Radiographs from your existing X-ray equipment route to the Vetology cloud automatically, and within minutes an AI screening report is generated. The report is available on the platform, by email, and through PMS integrations in some cases.

Each AI screening report lists detected findings, infered conclusions, and offers recommendations for next steps. Our recommended workflow is to read the radiographs first, form your own impression, then review the AI report as a structured second look. Used this way, it offers support, catching subtle findings without replacing your clinical expertise.

In straightforward cases, the report often confirms what you already saw and supports faster treatment decisions. In complex cases, it can help you decide whether to escalate to a board-certified veterinary radiologist.

For practice managers, this same workflow doubles as a training tool. Newer veterinarians can compare their impression against the AI report and a senior colleague’s review, freeing senior vets to mentor rather than carry every second read.

Adjusting To A New Workflow

As veterinary teams gain more experience with the platform, they become more proficient at using the AI screening results, identifying radiographic findings they may have missed before, and making clinical judgments about whether they need more help with a given case.

For veterinary technicians and support staff, veterinary AI implementation and our support team, can help them learn better radiograph positioning, and best practices to improve image quality and, therefore, AI and radiologist read accuracy.

After a few weeks, most veterinary clinics have a better understanding of where Vetology fits into their daily workflows. However, this is a good time to check in with the support team and make adjustments to address any workflow hiccups.

Two common workflow “hacks” the support team recommends include assigning a staff member to confirm image receipt and retrieve reports, and being sure to review AI screening results before approaching client conversations, as the results may change the clinical picture and plan.

Escalating To A Radiologist

Vetology gives your clinic direct access to boarded and board-eligible veterinary radiologists who can read images from dogs, cats, small mammals, exotics, and large animals. When you’re unsure about an image or case, you can submit the images to a human radiologist via the platform and receive a comprehensive report within two hours for STAT reads and 24 hours for routine cases. Vetology board-certified veterinary radiologists are available for follow-up questions via phone or email.

Over your first 30 days using Vetology, you’ll get better at determining when to escalate a case. Common reasons include:

  • AI findings that contradict clinical findings or history
  • Inconclusive results, or unclear next steps
  • Unusual anatomy
  • Unfamiliar species or complex conditions
  • Second opinions before surgery or referral
  • Solo practitioners who need a little more guidance before they can form a treatment plan.

Through our platform,  a second set of expert eyes is always available to help with imaging cases.

Checking In: Your First Month With Vetology

Vetology is invested in each clinic’s success on our platform. After the first month, the support team will check in to collect feedback on both the AI screening tool and teleradiology services, helping you to work through anything that needs adjustment.

The Vetology client services team is made up of experienced veterinary technicians, technology specialists, and customer care professionals who handle more than 14,000 support communications each year. Call anytime to reach a real person right away, or get a quick response via email or live chat.


Want to see AI in action?

To tour the platform and learn more, contact our team, or book a demo for a firsthand look at our AI and teleradiology platform.

How to Read AI Metrics Like a Confident Veterinarian

How to Read AI Metrics Like a Confident Veterinarian

A practical guide for veterinary professionals who want to understand AI validation data, not just trust it.

ABSTRACT

Vetology publishes 11 performance metrics for each of its 89+ veterinary radiology classifiers, built on a foundation of 300,000 multi-image patient cases. This article explains what each metric means in plain clinical language so veterinary professionals can interpret AI screening results with confidence. It covers sensitivity and specificity (how well the AI classifies cases), prevalence (how common a condition is in real-world practice), positive and negative predictive values (how reliable an individual prediction is once prevalence is factored in), confidence intervals, radiologist agreement rates, AUC, F1 score, and accuracy.

A key distinction: sensitivity and specificity evaluate model performance independent of prevalence, while PPV and NPV evaluate prediction reliability and are directly affected by how common a disease is. For rare conditions, a PPV that meaningfully exceeds the underlying prevalence indicates real predictive value. All metrics are published with full transparency at vetology.net/ai-classifier-performance.

Key terms: veterinary AI, classifier performance, sensitivity, specificity, positive predictive value (PPV), negative predictive value (NPV), prevalence, AUC, radiologist agreement rate, confusion matrix, veterinary radiology, AI validation, diagnostic AI screening

Why This Matters for Your Practice

We recently expanded our public AI performance dashboard from four metrics to eleven for each of our 89+ classifiers. That is a lot of numbers. And if you are like most veterinary professionals, you did not go to vet school to interpret ROC curves.

But these metrics directly affect how you use AI screening results in your clinical decisions. When an AI report flags cardiomegaly or rules out pleural effusion, the metrics behind that classifier tell you how much weight to give the result. Understanding a few key numbers can change how confidently you act on what the AI is telling you.

Here is what each metric means, in plain language, with real examples from our published data.

The Two Metrics You Probably Already Know

Sensitivity (the “catch rate”)
When the condition is present, how often does the AI detect it?
A sensitivity of 89.5% means the AI correctly identifies the condition in roughly 89 or 90 out of every 100 cases where it truly exists. The remaining cases are missed findings (false negatives).

What this means for you: Higher sensitivity means fewer missed findings. For conditions where early detection is critical, like heart failure, you want sensitivity to be as high as possible.

Specificity (the “all clear” rate)

When the condition is absent, how often does the AI correctly say so?
A specificity of 92.1% means that when there is no finding, the AI agrees 92 out of 100 times. The rest are false alarms (false positives).

What this means for you: Higher specificity means fewer unnecessary follow-ups. When the AI says “not present” and specificity is high, you can feel confident about that negative result.

Prevalence

How common is this condition in real-world practice?
We calculate prevalence from our clinical case database rather than the test set, so the number reflects actual clinical frequency. This tells you the baseline probability before the AI even looks at the image. A condition with 15% prevalence behaves very differently than one at 0.5%.

Why it matters here: Prevalence is essential for understanding the next two metrics, PPV and NPV. Without knowing how common a condition is, those numbers cannot be interpreted correctly.

REAL EXAMPLE

Our Heart Failure (Canine) classifier has 89.5% sensitivity and 92.1% specificity.

That means it catches about 9 out of 10 true heart failure cases, and when it says the heart looks normal, it is right about 92% of the time.

The Two Metrics That Answer Your Real Question

Sensitivity and specificity describe how the AI performs in controlled testing. But when you are looking at a patient’s results, the question you are actually asking is different: “The AI flagged this finding. Should I believe it?”

That is where PPV and NPV come in.

While Sensitivity and Specificity are metrics for evaluating what percentage of the time we expect a case to be classified correctly, Positive Predictive Value (PPV) and Negative Predictive Value (NPV) are metrics for evaluating what percentage of the time a prediction class is correct.

The biggest difference is that PPV and NPV metrics consider how prevalent a disease is, while Sensitivity and Specificity do not.

Sensitivity and Specificity are more useful for evaluating model performance, whereas PPV and NPV are more useful for interpreting model predictions.

Positive Predictive Value (PPV)

When the AI flags a finding, how often is it actually there?

PPV depends heavily on how common the condition is. A rare condition (low prevalence) will naturally have a lower PPV even with strong sensitivity and specificity, because most of the population does not have it.

We calculate PPV using real-world prevalence from our clinical case database so the number reflects what you would see in practice.

To further understand PPV, Radiopaedia offers this formula.1

Negative Predictive Value (NPV)

When the AI says a finding is not present, how often is it right?
For most conditions, NPV is very high because most patients do not have any given condition.

An NPV of 99.9% means you can be extremely confident in a negative result. This is where AI screening is often strongest: helping you confidently rule things out.

REAL EXAMPLE

Our Heart Failure (Canine) classifier has 89.5% Sensitivity and 92.1% Specificity, with a PPV of 11.9% and an NPV of 99.9%. That looks lopsided, and it is supposed to.

Heart failure has a prevalence of about 1.2% in our clinical database. So when the AI flags it, there is roughly a 1 in 8 chance the condition is truly present, which is still a significant increase from the baseline 1 in 83 rate. A PPV notably higher than the underlying prevalence indicates the model is providing real predictive power beyond random guessing. When it says “no heart failure,” you can be very confident.

How much PPV is clinically useful is ultimately a question for clinicians, and should be an ongoing discussion point as we continue to retrain and improve our models.

The clinical takeaway: a positive flag for a rare condition is a signal to look more closely, not a diagnosis. A negative result is a strong reassurance.

Section 1.5 in this 2022 Veterinary Radiology & Ultrasound article “Evaluating artificial intelligence algorithms for use in veterinary radiology” 2provides important supporting context to why the metrics we’ve discussed here, taken together, are important when making diagnoses: “Accuracy alone should not be used to judge an AI algorithm’s performance, as it does not give adequate insight into overall performance. Sensitivity, specificity, PPV, and NPV provide more complete information.” Table 1 in this article provides a brief summary of the core AI metrics we mentioned here.

The Metrics That Give You Context

95% Confidence Interval

How precise is the measurement?

A confidence interval of “85% – 93%” means the true sensitivity most likely falls within that range. Narrower intervals mean more cases were tested and the measurement is more precise.

Wider intervals (common for rarer conditions) mean fewer test cases were available.

We publish confidence intervals for both sensitivity and specificity so you can judge how much certainty is behind each number.

Radiologist Agreement Rate

How often do specialists agree with each other on this finding?

This might be the most important context metric on the dashboard. Some findings are straightforward and board-certified radiologists almost always agree; others are more subjective.

If specialists disagree 10-30% of the time on a given finding, an AI performing in that range is working within the natural variability of expert interpretation.

This number gives you a benchmark for what “good” means for each specific condition.

REAL EXAMPLE

Our Cardiomegaly (Canine) classifier has a Radiologist Agreement Rate of 93%. That means even board-certified radiologists disagree about 7% of the time on this finding.

The AI’s sensitivity of 75.6% and specificity of 86.3% should be understood in that context.

The Metrics for the Data-Curious

The remaining metrics are primarily used by data scientists and statisticians to evaluate classifier quality. They are published for completeness and for those who want the full picture.

AUC (Area Under the Curve)

How well does the classifier distinguish positive from negative overall?

A single number summarizing overall quality. 1.0 is perfect; 0.5 is no better than a coin flip. Values above 0.85 indicate strong performance.

Our Heart Failure classifier has an AUC of 0.95.

F1 Score

How well does the classifier balance catching findings with avoiding false alarms?

The harmonic mean of precision and recall. Useful for comparing classifiers where both false positives and false negatives matter.

Accuracy

What percentage of all cases did the AI get right?

This sounds like the most important number, but it can be misleading for rare conditions. If a condition has 1% prevalence, a system that always says “not present” would be 99% accurate while catching nothing. That is why we publish sensitivity and specificity alongside accuracy.

How to Use This in Your Practice

You do not need to memorize these metrics. But the next time you review an AI screening report, three quick checks can change how you use the results:

  1. Check the NPV for negative results. For most conditions, the NPV is 99%+. When the AI says “not present,” you can move on with confidence.
  2. Check the prevalence for positive flags. A positive flag on a rare condition (prevalence under 2%) is a signal to investigate further, not a confirmation. A positive flag on a common condition (prevalence above 10%) carries more weight. Also note: Incidental positives3 may require further review, rather than being automatically accepted as definitive evidence of illness.
  3. Check the Radiologist Agreement Rate for borderline calls. If specialists disagree 20% of the time on a finding, an AI result in the gray zone is reflecting genuine clinical ambiguity, not a system failure.

The full metrics for all 89+ classifiers are published at vetology.net/ai-classifier-performance. We publish them because informed trust is better than blind trust, and veterinary professionals deserve the data to make their own judgment calls.

Summing up: Relying on a solitary AI metric restricts diagnostic insight,4 whereas evaluating multiple performance dimensions in tandem offers a clearer perspective to pair with your own diagnostic expertise.

Resources

1Goel A, Positive predictive value. Reference article, Radiopaedia.org (accessed on 22 Sep 2026) https://doi.org/10.53347/rID-31423 

2Joslyn S, Alexander K. Evaluating artificial intelligence algorithms for use in veterinary radiology. Vet Radiol Ultrasound. 2022;63(Suppl. 1):871–879. https://onlinelibrary.wiley.com/doi/10.1111/vru.13159 

3Davenport, Matthew S. Incidental Findings and Low-Value Care. American Journal of Roentgenology 2023 221:1, 117-123 10.2214/AJR.22.28926 https://www.ajronline.org/doi/10.2214/AJR.22.28926 

4Klontzas, M.E., Groot Lipman, K.B.W., Akinci D’ Antonoli, T., et al. ESR Essentials: common performance metrics in AI—practice recommendations by the European Society of Medical Imaging Informatics. Eur Radiol 36, 1528–1540 (2026). https://doi.org/10.1007/s00330-025-11890-w 

View the complete AI performance dashboard

Sensitivity, specificity, PPV, NPV, confidence intervals, and Radiologist Agreement Rate for every classifier we validate.

Vetology’s Veterinary AI Dashboard Now Tracks 11 Public Metrics

Vetology’s Veterinary AI Dashboard Now Tracks 11 Public Metrics

FOR IMMEDIATE RELEASE

Vetology Expands Public AI Validation Dashboard to 11 Metrics Per Condition Classifier, Commits to Ongoing Model Retraining

Vetology publishes full statistical profiles for 89+ classifiers, reinforcing that building AI is only half the job.

March 31, 2026 – SAN DIEGO – Vetology, a provider of AI-generated radiology screening reports and board-certified veterinary teleradiology, today expanded its publicly available AI performance dashboard from four metrics per classifier to eleven. The update covers 89+ validated classifiers across canine and feline thoracic, abdominal, and musculoskeletal imaging.

The expanded dashboard now reports sensitivity, specificity, positive predictive value, negative predictive value, AUC, F1 score, accuracy, prevalence, confidence intervals, and Radiologist Agreement Rate for each condition. The data is available on our website. 

The update also reflects Vetology’s commitment to maintaining its existing classifiers alongside building new ones. Of the 89+ classifiers currently published, 31 are retrained models that were originally released, then revalidated against updated board-certified radiologist consensus data. The oldest classifiers in the current dashboard date to August 2024; all have been revalidated with confusion matrices generated as recently as February 2026.

“AI is changing fast, and we are working just as hard to keep pace. We put the same rigor into maintaining our older models as we do into building new ones. Publishing the data for all of them, new and retrained, is how we honor our commitment to our veterinary partners and patients.”

Eric Goldman, President, Vetology

New classifiers added in this update include Obscuring Pleural Effusion, Esophageal Enlargement, Intervertebral Disc Disease (Thoracic), Small Intestine Enlargement (Feline), Colon Diffuse Distension (Feline), and a consolidated Heart Failure classifier for canine imaging. The Heart Failure classifier reports 89.5% sensitivity and 92.1% specificity; the Obscuring Pleural Effusion classifier, designed to flag cases where fluid volume may limit diagnostic interpretation, reports 87.2% sensitivity and 96.7% specificity.

“We’re improving our classifiers every month, and every update is revalidated against fresh consensus reads from board-certified radiologists – not the same training set warmed over. That’s why we publish eleven metrics per classifier instead of the one or two you’ll see from other vendors. Sensitivity by itself doesn’t tell a clinician whether to trust a result. PPV, confidence intervals, specificity – that’s what lets a veterinarian decide how much weight to put on what the model is telling them. We think that level of transparency should be the baseline for veterinary imaging AI. As far as we can tell, nobody else is publishing it.”

Cory Clemmons, CTO, Vetology

Vetology’s validation data is built on a foundation of 300,000 multi-image patient cases, with classifier performance validated against board-certified veterinary radiologist consensus. The company publishes these metrics as part of its commitment to transparency in an industry where, according to a 2026 Frontiers in Veterinary Science audit, 63.3% of commercial veterinary AI vendors do not disclose validation data publicly.

ABOUT VETOLOGY
Vetology provides AI-generated radiology screening reports and on-demand teleradiology consultations from board-certified veterinary radiologists, cardiologists and a dentist, giving veterinary practices both speed and specialist depth in a single platform. The Vetology AI screening system covers a growing list of conditions across canine and feline thoracic, abdominal, and musculoskeletal imaging. Screening results are designed to fit naturally into existing clinic workflows, so veterinary teams can move from image to informed decision without adding steps to their day. Vetology was founded on the belief that humans and AI are better together.

Learn more at vetology.net.

Media Contacts

Thanks for reading! If you’d like to learn more or have any questions, we’d love to hear from you.

Vetology’s Veterinary AI Dashboard Now Tracks 11 Public Metrics

Vetology Strengthens Leadership Team with New Director of Sales

FOR IMMEDIATE RELEASE

Veterinary commercial leader Pierre D'Amours joins growing team as Vetology expands board-certified radiologist services and AI diagnostic platform

March 16, 2026 – SAN DIEGO, CA – Vetology, a provider of AI-assisted radiology and board-certified teleradiology services for veterinary practices, today announced the addition of Pierre D’Amours as Director of Sales. The newly created role reflects the company’s growth trajectory.

President Eric Goldman, who has led Vetology’s commercial efforts since founding the company, and D’Amours will partner closely to build a sales organization that brings Vetology’s services to more veterinary practices across North America and internationally.

Vetology’s platform now includes 94+ feline and canine AI classifiers that screen radiographs for conditions across thorax, abdomen, spine, and musculoskeletal studies, with new classifiers releasing monthly and all performance metrics published publicly. The company also provides on-demand access to board-certified veterinary radiologists for specialist-level interpretation. As the platform and radiologist team grow, Vetology is investing in the commercial infrastructure to match.

We started Vetology to close the gap between the number of practices that need diagnostic imaging expertise and the number of board-certified radiologists available to provide it.  AI was the solution — a way to give every practice access to consistent, validated screening regardless of where they are and when they need it. We paired that with our own team of board-certified radiologists so practices have both. I’ve been having this conversation with practices since day one. Pierre has the industry relationships and credibility to help us bring Vetology’s service and solutions to more practices, and I’m excited to work alongside him.

Eric Goldman, President, Vetology

An Industry Insider

D’Amours brings seven years of veterinary commercial experience as Vice President of North America Sales & Operations at Movora (Vimian Group AB), where he ran a $70M+ veterinary medical devices and SaaS business. He is fluent in English and French, holds a Bachelor of Commerce from Concordia University, and has deep relationships across veterinary practices, distributors, and corporate groups throughout North America.

Pierre understands the challenges inherent in running a veterinary practice and how the right technology can solve real problems in day-to-day operations. At Vetology he will work with veterinary doctors and management teams to make sure that we are delivering on our promises both during and after the sale.

When I evaluated Vetology, what stood out was a company that had done the hard work first — building the AI, hiring board-certified radiologists, validating the classifiers, and publishing all of it for the industry to review. That kind of transparency is rare in this space. I’ve spent years working with veterinary practices, and the right technology should solve real operational problems, not add complexity.

My focus is to partner closely with DVMs to make sure we deliver on that promise — during the sales process and well after implementation — and to build a sales team grounded in trust, honest about where our solutions fit, and focused on long-term partnerships over transactions.

Pierre D’Amours, Director of Sales, Vetology 

# # #

ABOUT VETOLOGY

Vetology is a veterinary diagnostic imaging support company that provides AI-generated screening reports and traditional teleradiology services by board-certified veterinary radiologists. Built by radiologists, Vetology focuses on improving patient outcomes through accuracy, speed, and reliability in diagnostic imaging. Our platform is designed to integrate seamlessly into existing hospital workflows, helping clinicians make informed decisions quickly.

Learn more at vetology.net.

Media Contacts

Thanks for reading! If you’d like to learn more or have any questions, we’d love to hear from you.

Radiology Support Built for the Way Veterinarians Work

Radiology Support Built for the Way Veterinarians Work

AI Screenings Add Fast Imaging Analysis to the Veterinary Generalist's Toolkit

Veterinarians have a remarkable and diverse skillset. On any given day, a GP might perform surgery, vaccinate a puppy, help a pet parent manage a complex diabetes case, and perform a dental procedure. No other medical profession asks its practitioners to work across this many disciplines at this level of competence, every single day.

Radiology is one of those disciplines. Board-certified veterinary radiologists spend years in fellowship training after veterinary school, developing expertise in a field that spans thousands of conditions across multiple species and body systems. In general practice, that same breadth of imaging interpretation falls to the veterinarian.

Vetology’s AI screening report was designed with this reality in mind. Not to replace the veterinarian’s judgment, but to add a layer of specialist-level screening that supports the work practicing veterinarians are already doing.

How It Works in Practice

When a practice submits radiographs through Vetology, the AI automatically analyzes every image across our growing list of classifiers covering canine and feline thorax, abdomen, and spine/musculoskeletal conditions. Results arrive in minutes. There is no extra submission, no case selection, and no waiting for a specialist’s availability.

The system has been validated on a foundation of 300,000 board-certified veterinary radiologist-reviewed multi-image cases. These are real patient studies from real veterinary practices, each reviewed by diplomates of the American College of Veterinary Radiology (DACVR) or European College of Veterinary Diagnostic Imaging (ECVDI).

The AI provides a structured analysis that highlights findings across 94+ conditions. Some of these are conditions the veterinarian is already evaluating. Others are incidental findings that benefit from being flagged: subtle lymphadenopathy alongside a cardiac workup, early organ size changes on a GI study, mineralization that warrants monitoring. The veterinarian reviews everything in context and makes every clinical decision.

A Resource for the Whole Practice Team

AI screening benefits more than the doctor reading the images.

For veterinary technicians, AI reports create a learning opportunity built into the daily workflow. Techs who position patients and capture radiographs can see what the AI identified on the images they produced. This builds familiarity with imaging findings over time and adds professional development value to work the team is already doing.

For practice managers and operations leads, the impact shows up in workflow. When more findings are identified during the initial visit, more treatment conversations happen while the client is still in the room. This means smoother scheduling, more complete appointments, and fewer situations where the team needs to coordinate follow-up calls and return visits after the fact.

For front desk staff, the benefit is practical: when cases are more fully resolved on the first visit, there are fewer follow-up calls to coordinate and fewer schedule adjustments to manage. The front desk may not read radiographs, but they feel the difference when the day runs more smoothly.

Confidence and Collaboration

Vetology AI is a screening tool, not a diagnostic replacement. It does not tell the veterinarian what to do. It provides additional information that the DVM incorporates into their clinical picture alongside history, physical exam, and their own radiographic assessment.

Veterinarians who use AI screening consistently describe it as a confidence builder. When the AI confirms their interpretation, it reinforces their treatment plan. When the AI highlights something they had not focused on, it gives them a reason to take a second look. Either way, they have more information available when making their clinical decisions.

That added confidence has a practical impact. Veterinarians who feel well-supported in their imaging interpretation tend to use diagnostic imaging more effectively in discussions with clients, and keep more of their caseload in-house.

Designed for General Practice Economics

Vetology’s unlimited monthly subscription is built for the way general practice operates. There are no per-case fees, no contracts, and we include a PACS for free if you need one. The system integrates with widely used practice management systems and AI scribes including ezyVet, DaySmart Vet, CoVet, Scribblevet, VetRocket with more on the way, and includes free DICOM storage.

For practices that also need board-certified radiologist interpretations, Vetology offers teleradiology with 2-hour STAT and 24-hour routine turnaround from DACVR and ECVDI diplomates, as well as board-certified cardiologists and a board-certified dentist. AI screening and specialist reads work together under one platform.

Specialist-Level Support, Built for Generalists

The breadth of what general practice veterinarians manage every day is extraordinary. Vetology’s role is to make one part of that work a little easier by adding consistent, validated radiology screening to every imaging study the practice performs.

It is the kind of support that lets the whole team do what they do best, with more information and more confidence behind every decision.

Want to see AI in action?

To tour the platform and learn more, contact our team, or book a demo for a firsthand look at our AI and teleradiology platform.

Pin It on Pinterest