When You and the AI Radiology Report Disagree
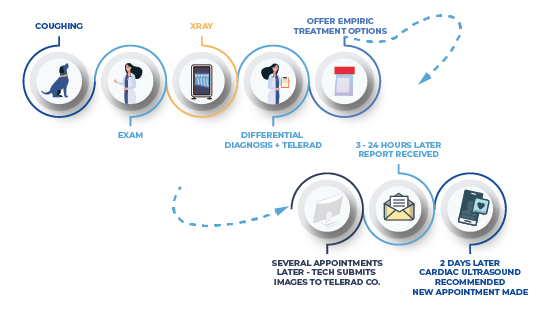
Article Abstract: When an AI radiology report flags something you didn’t see, or skips something you did, the natural reaction is to call it a miss, a false positive, or proof the tool isn’t reliable. While that reaction makes sense, in some cases, disagreements aren’t failures. Sometimes, they’re a second opinion worth working through. Move through the condition(s) in question in five steps:
- Consider whether the suspcicious AI finding is something you typically look for or routinely look past;
- Correlate it against the patient’s signalment, history, and presentation;
- Escalate high-stakes cases (surgery, hospitalization, referral) to a board-certified veterinary radiologist;
- Send feedback when you suspect that the AI finding is wrong, this routes the case to Vetology’s radiologist and retrains the classifier; and
- Use the radiologist update or teleradiology report to confirm or sharpen your own radiograph reading over time.
A false positive in an AI radiology report, or an unexpected flag isn’t a flaw in your judgment or in the tool. It should be treated as a prompt to look again, and a chance to catch something relevant to the patient as a whole. Here’s how to handle an AI screening report that appears to disagree with your clinical impression.
What to Do Next: When the AI Report and Your Clinical Impression Disagree
When you first start using an AI radiology screening tool, you might feel confused when the report points out findings you didn’t see or that you don’t feel are relevant to the case. While that feeling can take some getting used to, you shouldn’t consider that disagreement a problem.
After all, clinical disagreement and healthy debate among veterinary radiologists and general practice colleagues are what challenge us to consider cases from varying perspectives. Ultimately, this leads to better outcomes for patients.
Here’s what to do when the AI report doesn’t match your clinical judgment. Maybe you suspect a false positive on one or more conditions in the read, or you’re simply not sure what to believe and want a second opinion on the patient’s behalf before committing to a high-stakes treatment plan.
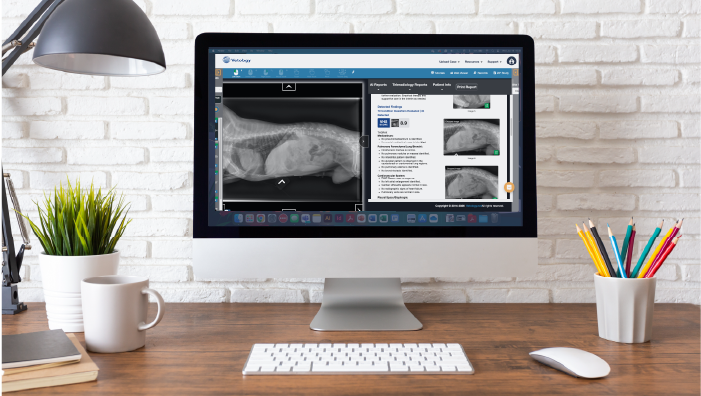
Before we get started, let’s talk about something that has a powerful effect on every AI report and is easy to take for granted: image quality. Because the AI reads what’s in the image, the quality of what you submit directly shapes the quality of the read.
For best results, we recommend three appropriately collimated and positioned views per study – two laterals and a VD. Multiple planes matter, because organs can obscure one another and pathology can hide in a single view. Overexposure, underexposure, less-than-textbook positioning, and a range of image-level artifacts can all affect the AI’s findings.
Step 1: Consider the AI finding
Take a step back and consider the result in question. Then, ask yourself:
- Is this something I typically look for?
- Is this a common finding that I usually overlook?
- Is this result relevant to the case?
AI screening tools evaluate each image against a broad list of conditions, so your report will probably include findings that you usually look past because they are common, subtle, or inconsequential. An AI report will be more complete than you’re used to because the AI looks at each image, and runs each condition classifier (no matter how many there are) and reports back on each.
However, it might also point out a finding that would otherwise be overlooked because it’s not relevant to the current issue, but could be relevant to the patient as a whole. So, try to keep an open mind. Take a second look at the image and see if you can confirm what the AI has reported.
Step 2: Correlate the results to real life
If you’re still unsure whether a particular issue is actually present on a radiograph or could be an artifact or false positive, consider the clinical history and current presentation.
For example, if the AI flags early cardiomegaly in a patient without heart-related symptoms, ask yourself:
- Does this patient’s signalment support the possibility of heart disease?
- Could the patient’s conformation or radiograph positioning affect the vertebral heart score?
- Could the patient’s presenting complaint relate in any way to this finding?
Always defer to your clinical judgment and exam findings, using the AI screening report as a second opinion that will help you either support or further investigate a diagnosis before moving forward with a treatment plan.
Step 3: Escalate the case
Finally, if you can’t come to an agreement between what you see and what the AI sees, or if the stakes of such disagreement are high (e.g., decisions to go to surgery, hospitalize, or refer to a specialist), you can escalate the case to a human, board-certified or board-eligible veterinary radiologist.
Vetology users can easily order teleradiology reports via the same platform. All images are sent to and stored within the Vetology platform, where a radiologist can quickly access them at your request.

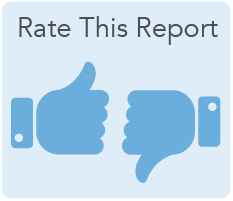
Step 4: Send feedback
If you suspect that the AI is wrong (which it can be despite our best efforts), clicking the thumbs down button and adding details about the issue will send the case back to the developer team so they can schedule the classifier for retraining. It will also send the case to Vetology’s imaging technicians, who will forward it to the in-house boarded radiologist. The radiologist will often provide guidance to help you move the case forward at no charge.
Sending this feedback helps you move forward confidently, and helps Vetology hone the AI tool for enhanced accuracy and sensitivity.
Step 5: Turn uncertainty into a learning opportunity
AI radiology screening tools aren’t designed to eliminate the need for veterinarians to read their own images. Nor do we recommend their use as a diagnostic tool. Rather, AI screening can be a useful first check, and a support-partner that helps clinicians learn and improves their skills.
Comparing initial impressions against the AI screening report and the radiologist’s interpretation (if you order one) provides an in-depth analysis of images through different eyes.
Disagreement as a Feature, not a Flaw
An AI screening tool that tells you what you already know confirms your opinion and supports your judgement. However, screening tools that provide in-depth, validated results can also encourage you to look at cases more closely or see them in a different light. Disagreement is a fact of life, and it can feel frustrating at first, but as you become more confident and familiar with the reports and your new workflow, even disagreements can become useful learning opportunities.