Vetology Strengthens Leadership Team with New Director of Sales

Vetology Strengthens Leadership Team with New Director of Sales

FOR IMMEDIATE RELEASE

Veterinary commercial leader Pierre D'Amours joins growing team as Vetology expands board-certified radiologist services and AI diagnostic platform

March 16, 2026 – SAN DIEGO, CA – Vetology, a provider of AI-assisted radiology and board-certified teleradiology services for veterinary practices, today announced the addition of Pierre D’Amours as Director of Sales. The newly created role reflects the company’s growth trajectory.

President Eric Goldman, who has led Vetology’s commercial efforts since founding the company, and D’Amours will partner closely to build a sales organization that brings Vetology’s services to more veterinary practices across North America and internationally.

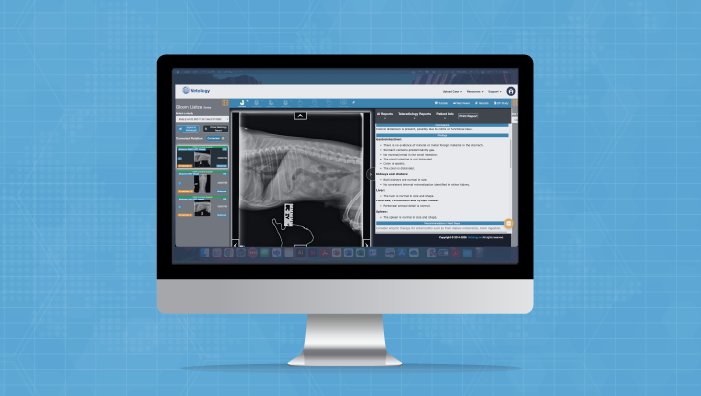
Vetology’s platform now includes 94+ feline and canine AI classifiers that screen radiographs for conditions across thorax, abdomen, spine, and musculoskeletal studies, with new classifiers releasing monthly and all performance metrics published publicly. The company also provides on-demand access to board-certified veterinary radiologists for specialist-level interpretation. As the platform and radiologist team grow, Vetology is investing in the commercial infrastructure to match.

We started Vetology to close the gap between the number of practices that need diagnostic imaging expertise and the number of board-certified radiologists available to provide it.  AI was the solution — a way to give every practice access to consistent, validated screening regardless of where they are and when they need it. We paired that with our own team of board-certified radiologists so practices have both. I’ve been having this conversation with practices since day one. Pierre has the industry relationships and credibility to help us bring Vetology’s service and solutions to more practices, and I’m excited to work alongside him.

Eric Goldman, President, Vetology

An Industry Insider

D’Amours brings seven years of veterinary commercial experience as Vice President of North America Sales & Operations at Movora (Vimian Group AB), where he ran a $70M+ veterinary medical devices and SaaS business. He is fluent in English and French, holds a Bachelor of Commerce from Concordia University, and has deep relationships across veterinary practices, distributors, and corporate groups throughout North America.

Pierre understands the challenges inherent in running a veterinary practice and how the right technology can solve real problems in day-to-day operations. At Vetology he will work with veterinary doctors and management teams to make sure that we are delivering on our promises both during and after the sale.

When I evaluated Vetology, what stood out was a company that had done the hard work first — building the AI, hiring board-certified radiologists, validating the classifiers, and publishing all of it for the industry to review. That kind of transparency is rare in this space. I’ve spent years working with veterinary practices, and the right technology should solve real operational problems, not add complexity.

My focus is to partner closely with DVMs to make sure we deliver on that promise — during the sales process and well after implementation — and to build a sales team grounded in trust, honest about where our solutions fit, and focused on long-term partnerships over transactions.

Pierre D’Amours, Director of Sales, Vetology 

# # #

ABOUT VETOLOGY

Vetology is a veterinary diagnostic imaging support company that provides AI-generated screening reports and traditional teleradiology services by board-certified veterinary radiologists. Built by radiologists, Vetology focuses on improving patient outcomes through accuracy, speed, and reliability in diagnostic imaging. Our platform is designed to integrate seamlessly into existing hospital workflows, helping clinicians make informed decisions quickly.

Learn more at vetology.net.

Media Contacts

Thanks for reading! If you’d like to learn more or have any questions, we’d love to hear from you.

Radiology Support Built for the Way Veterinarians Work

Radiology Support Built for the Way Veterinarians Work

How AI screening adds specialist-level imaging analysis to the generalist's toolkit

Veterinarians have a remarkable and diverse skillset. On any given day, a GP might perform surgery, vaccinate a puppy, help a pet parent manage a complex diabetes case, and perform a dental procedure. No other medical profession asks its practitioners to work across this many disciplines at this level of competence, every single day.

Radiology is one of those disciplines. Board-certified veterinary radiologists spend years in fellowship training after veterinary school, developing expertise in a field that spans thousands of conditions across multiple species and body systems. In general practice, that same breadth of imaging interpretation falls to the veterinarian.

Vetology’s AI screening report was designed with this reality in mind. Not to replace the veterinarian’s judgment, but to add a layer of specialist-level screening that supports the work practicing veterinarians are already doing.

How It Works in Practice

When a practice submits radiographs through Vetology, the AI automatically analyzes every image across our growing list of classifiers covering canine and feline thorax, abdomen, and spine/musculoskeletal conditions. Results arrive in minutes. There is no extra submission, no case selection, and no waiting for a specialist’s availability.

The system has been validated on a foundation of 300,000 board-certified veterinary radiologist-reviewed multi-image cases. These are real patient studies from real veterinary practices, each reviewed by diplomates of the American College of Veterinary Radiology (DACVR) or European College of Veterinary Diagnostic Imaging (ECVDI).

The AI provides a structured analysis that highlights findings across 94+ conditions. Some of these are conditions the veterinarian is already evaluating. Others are incidental findings that benefit from being flagged: subtle lymphadenopathy alongside a cardiac workup, early organ size changes on a GI study, mineralization that warrants monitoring. The veterinarian reviews everything in context and makes every clinical decision.

A Resource for the Whole Practice Team

AI screening benefits more than the doctor reading the images.

For veterinary technicians, AI reports create a learning opportunity built into the daily workflow. Techs who position patients and capture radiographs can see what the AI identified on the images they produced. This builds familiarity with imaging findings over time and adds professional development value to work the team is already doing.

For practice managers and operations leads, the impact shows up in workflow. When more findings are identified during the initial visit, more treatment conversations happen while the client is still in the room. This means smoother scheduling, more complete appointments, and fewer situations where the team needs to coordinate follow-up calls and return visits after the fact.

For front desk staff, the benefit is practical: when cases are more fully resolved on the first visit, there are fewer follow-up calls to coordinate and fewer schedule adjustments to manage. The front desk may not read radiographs, but they feel the difference when the day runs more smoothly.

Confidence and Collaboration

Vetology AI is a screening tool, not a diagnostic replacement. It does not tell the veterinarian what to do. It provides additional information that the DVM incorporates into their clinical picture alongside history, physical exam, and their own radiographic assessment.

Veterinarians who use AI screening consistently describe it as a confidence builder. When the AI confirms their interpretation, it reinforces their treatment plan. When the AI highlights something they had not focused on, it gives them a reason to take a second look. Either way, they have more information available when making their clinical decisions.

That added confidence has a practical impact. Veterinarians who feel well-supported in their imaging interpretation tend to use diagnostic imaging more effectively in discussions with clients, and keep more of their caseload in-house.

Designed for General Practice Economics

Vetology’s unlimited monthly subscription is built for the way general practice operates. There are no per-case fees, no contracts, and we include a PACS for free if you need one. The system integrates with widely used practice management systems and AI scribes including ezyVet, DaySmart Vet, CoVet, Scribblevet, VetRocket with more on the way, and includes free DICOM storage.

For practices that also need board-certified radiologist interpretations, Vetology offers teleradiology with 2-hour STAT and 24-hour routine turnaround from DACVR and ECVDI diplomates, as well as board-certified cardiologists and a board-certified dentist. AI screening and specialist reads work together under one platform.

Specialist-Level Support, Built for Generalists

The breadth of what general practice veterinarians manage every day is extraordinary. Vetology’s role is to make one part of that work a little easier by adding consistent, validated radiology screening to every imaging study the practice performs.

It is the kind of support that lets the whole team do what they do best, with more information and more confidence behind every decision.

Want to see AI in action?

To tour the platform and learn more, contact our team, or book a demo for a firsthand look at our AI and teleradiology platform.

Interpreting Classifier Results: A First Look at Data Science Metrics

Interpreting Classifier Results: A First Look at Data Science Metrics

What sensitivity, specificity, radiologist agreement rate, and test cases actually tell you about AI diagnostic performance

Written by – Benjamin Cote, Data Scientist | Vetology

As part of Vetology’s push to be transparent about our AI products, we recently published all of our condition classifiers on our website (find them here if you haven’t taken a look yet: AI Classifier Performance). Since we want you to be able to see how each of our models performs and draw your own conclusions, this article is designed to provide you with some extra knowledge and context to interpret our metrics.

On the AI Condition Classifier Performance Metrics page, we include several key metrics on each of our conditions. For the purposes of this article, we will focus on: Sensitivity, Specificity, Radiologist Agreement Rate, and Number of Test Cases. Each measure is a piece of the classifier puzzle, and by understanding the ways they interact, you can see the bigger picture come together. We’ll cover additional metrics in future articles. 

Sensitivity and Specificity

highlight of the sensitivity and specificity data

Front and center on each published classifier, you can see the Sensitivity and Specificity scores achieved by that model. These are both common metrics used in data science to measure model performance, and at Vetology they are the primary way we determine if a model is strong enough to be released.

They can be thought of as a pair, each capturing the same information but on different classes of data. You can think of them as a see-saw: A model that predicts every case as positive would have 100% Sensitivity (but 0% Specificity), and a model that predicts every case as negative would have 100% Specificity (but 0% Sensitivity), and neither would be useful. We want to get Sensitivity and Specificity as high as possible, so the challenge is how to get each metric to improve without harming the other.

What is Sensitivity?

Sensitivity (True Positive Rate)

Sensitivity is a measure of how often our model correctly recognizes that a disease is present in the patient. It answers the question: “When I get a Positive prediction, how often is the case actually Positive?”

When Sensitivity is high, the model correctly recognizes what a given disease looks like. It’s as if the model is telling us: “I know what heart failure looks like, and that is heart failure.”

One way to improve Sensitivity is by training the model on more examples that are positive for the condition so it understands the variation within a disease across many different breeds, and sizes.

What is Specificity?

Specificity (True Negative Rate)

Specificity is a measure of how often our model correctly determines that a disease is absent. It answers the question: “When I get a Negative prediction, how often is the case actually Negative?”

When Specificity is high, the model can correctly distinguish between a given disease and all other diseases, as if the model is telling us: “I don’t know what that is, but I know that is not an example of heart failure.”

One way to improve Specificity is by training the model on more images that are negative for the condition so it understands what kinds of information are unrelated to this disease. For instance, if we are trying to identify pulmonary nodules, the size and shape of the heart are unlikely to help us make our diagnosis. Instead, we want enough data that our classifier can isolate findings related to pulmonary nodules and ignore irrelevant visual information. That way when key findings aren’t present, the classifier will confidently predict that a disease isn’t present.

What Can You Learn from These Metrics?

When viewed together, you can get an estimate of how well a model performs when predicting on Positives (Sensitivity) and Negatives (Specificity). However, when forced to choose between prioritizing model Sensitivity or Specificity, we tend to prioritize Specificity. This is because our models are trained on many more negative images than positives.

We train on mismatched proportions because even the most common diseases only occur in a small percentage of cases; this imbalance ensures that we don’t over-predict the presence of diseases. A consequence of this is that Sensitivity and Specificity percentages are calculated on differently-sized classes, and a 1% increase in Specificity usually means a greater increase in total model accuracy than a 1% increase in Sensitivity.

The math behind these metrics is not especially complicated, but there are some nuances that require more context. If you want to learn more about how we calculate Sensitivity and Specificity, look at the In-Depth Calculation section at the end of this article.

Radiologist Agreement Rate

Radiologist Agreement Rate

The percentage of cases where two US Board Certified Veterinary Radiologists produce the same label (Positive or Negative) on an image. This serves as a real-world benchmark for evaluating AI performance.

highlight of the location of the radiologist agreement rate on the table

We calculate the Radiologist Agreement Rate by comparing the labels that expert radiologists provide on a blind set of shared images. Among this set of Positive and Negative images, we calculate the number of cases the radiologists agreed on out of the total number of cases they reviewed. Regardless of whether they agreed a case is Negative or Positive, so long as the radiologists make the same decision on an image we consider it an agreement.

Interpreting Radiographs is as much an art as it is a science! Some conditions can be easily diagnosed from radiograph findings, others cannot be. Some conditions are easily visible on a radiograph, others are not. Some conditions look similar to each other, others are completely unique! All that to say, it’s understandable why two expert radiologists may disagree when diagnosing the same patient. It also stands to reason that if a condition is hard for an expert radiologist to interpret from radiograph scans, our classifier may also have trouble consistently identifying a disease.

What Can You Learn from Radiologist Agreement Rate?

Low Agreement Rate

If the radiologist agreement rate is low, this means a condition is hard for radiologists to reliably diagnose. This is a place where our models often shine.

  • With extremely rare conditions, a clinician or radiologist may encounter it only a handful of times over the course of their career.
    • In contrast, our models are trained on hundreds or thousands of examples, so our sensitivity and specificity metrics can often surpass radiologist agreement rates.
    • Through the aggregation of clinical examples globally, these models can help you feel confident in recognizing rare findings.
  • Other times, agreement rate is low because a disease is hard for radiologists to determine visually.
    • Our models may struggle with these conditions too. Sometimes they can pick up on patterns too minuscule for the human eye to see, but other times it’s just as hard for the neural network to come to a conclusion.
    • When this is the case, our models may have low sensitivity and specificity scores that mirror low radiologist agreement rate.

High Agreement Rate

If the radiologist agreement rate is high, it means that this condition is easier for radiologists to reliably diagnose.

  • This could be because the disease presents consistently on radiographs, because it is easy to identify, or because a particular finding unambiguously indicates that disease.
    • When the agreement rate is high, model performance also tends to be high because the neural network is picking up on the same visual patterns as the radiologists.
  • However, you’ll notice that some model performance metrics don’t match their high radiologist agreement rate.
    • This is something we take seriously—we want every model to perform just as well if not better than the agreement rate so you can be confident in our predictions.

TRANSPARENCY NOTE

When you see conditions published with scores that are below the agreement rate, you can be confident that we are working to retrain a higher-performing model. Sometimes we will release a model below agreement rate because clinics have specifically requested it, and we feel confident that it has strong performance even if it is not as high as we would like. Other times, we are limited by low Positive case counts and have trained the highest-performing model we can at the time of publication. The decision usually comes down to whether it’s a high-priority condition or not.

Total Cases Evaluated

Total Test Cases

The number of unique patient cases used to evaluate a classifier and generate Sensitivity and Specificity metrics. This includes both Positive cases (disease present) and Negative cases (disease absent, which may include other conditions).

Highlight of the location of test cases on the chart

The number of evaluated cases shows the number of unique cases we used to test that particular classifier and generate our Sensitivity and Specificity metrics.

For example, the Canine Thorax condition Heart Failure Left has 10,951 total test cases, which means our performance metrics come from generating model predictions on 10,951 unique sets of radiographs, all from different dogs.

This number includes both the Positive cases where a disease is present, and the Negative cases. However, just because a case is labeled as Negative, that doesn’t always mean the animal is healthy – in fact, we make sure our set of Negative examples includes cases with a variety of other findings or diseases within the body region, just one of which is a “healthy” finding.

What Can You Learn from Test Case Counts?

As the number of test cases grows, so does the variation in examples our model is tested against. Each case introduces a unique combination of animal size, age, scan quality, and number of diseases present or absent. When a condition is tested on large quantities of data and has high Sensitivity and Specificity performance, you can feel certain that the model is robust enough to find the disease in animals of any size; it can handle any curveball case you throw at it.

An In-Depth Look: Sensitivity and Specificity Calculation

In data science, we often categorize our data by multiple labels at the same time. This can easily lead to confusion, which is why we describe outcomes using terminology like True Positive, True Negative, False Positive, and False Negative.

The table below shows the difference between each label. In short:

  • A case is True if the predicted label matches the actual label, and False if the predicted label does not match the actual label.
    • For example, if a model predicts that cardiomegaly is present in an image but a radiologist has determined that cardiomegaly is not present, we would call that classification a False Positive because the classifier falsely predicted cardiomegaly to be positive.
Condition Is Present Condition Is Absent
Model Predicts Condition as Present True Positive (TP) False Positive (FP)
Model Predicts Condition as Absent False Negative (FN) True Negative (TN)

Sensitivity

True Positives ÷ (True Positives + False Negatives)

Total correctly identified positives out of all cases where the condition is actually present

Specificity

True Negatives ÷ (True Negatives + False Positives)

Total correctly identified negatives out of all cases where the condition is actually absent

Why Specificity Improvements Have a Bigger Impact

Earlier in this article, I explained that we try to prioritize model Specificity over Sensitivity if we can no longer actively improve both metrics. Let’s explore why that is by walking through a short example.

Imagine we have a dataset with 500 Positives, 5,000 Negatives, and the model has 85% Sensitivity and 85% Specificity:

Baseline: 85% Sensitivity, 85% Specificity
Positive Cases Negative Cases Total Cases
Total 500 5,000 5,500
Predicted Correctly 425 4,250 4,675
Predicted Incorrectly 75 750 825
Metric Score 85% Sensitivity 85% Specificity 85% Accuracy

Based on the number of Positive cases, the model correctly predicted the disease on 425 cases and only misclassified 75 cases -pretty good! But 85% Specificity on 5,000 Negative cases means that 4,250 cases were predicted correctly as normal, and 750 cases were misclassified. While the scores are the same, they represent very different numbers of misclassified images.

Let’s look at what happens to model accuracy if we improve either Sensitivity or Specificity by 10% without changing the other metric’s score:

Scenario A: Improve Sensitivity by 10%
Positive Cases Negative Cases Total Cases
Total 500 5,000 5,500
Predicted Correctly 475 (+50) 4,250 4,725 (+50)
Predicted Incorrectly 25 (-50) 750 775 (-50)
Metric Score 95% Sensitivity (+10%) 85% Specificity 85.9% Accuracy (+0.9%)
Scenario B: Improve Specificity by 10%
Positive Cases Negative Cases Total Cases
Total 500 5,000 5,500
Predicted Correctly 425 4,750 (+500) 5,175 (+500)
Predicted Incorrectly 75 250 (-500) 325 (-500)
Metric Score 85% Sensitivity 95% Specificity (+10%) 94.1% Accuracy (+9.1%)

KEY TAKEAWAY

A 10% increase in Sensitivity improves overall accuracy by 0.9%, while a 10% increase in Specificity improves overall accuracy by 9.1%. When there are so many more Negative cases than Positive cases, an equivalent increase in percentage does not equate to an equivalent increase in model accuracy.

Conclusion

Assessing the performance of a disease classifier can be tricky. Sometimes it’s unclear what a metric represents, or how to compare across models. It can also be difficult to interpret when a classifier is performing well because you have to consider not only its Sensitivity and Specificity scores, but also the Radiologist Agreement Rate.

If Sensitivity and Specificity are both around 70% and the Radiologist Agreement Rate is 63%, then it’s a strong model that can pick up on details that even expert radiologists may not see. However, if a model with those same scores had a Radiologist Agreement Rate of 85%, then the model would be significantly underperforming. Everything is relative, and at Vetology we have to consider how all our metrics interact before we publish new condition classifiers.

Now that you have an idea of what these metrics mean, take a look at our classifier results. Transparency means you can be part of this process. Notice the great work we’ve done, but also notice the areas we need to work on. With our monthly bundle releases, we are constantly increasing performance of existing models and adding coverage through new disease classifiers. So please, check back in soon and see where we’ve made our latest improvements.

Want to see AI in action?

To tour the platform and learn more, contact our team, or book a demo for a firsthand look at our AI and teleradiology platform.

Vetology Strengthens Leadership Team with New Director of Sales

Vetology AI Releases Classifier Performance Metrics

Vetology AI Becomes First and Only Veterinary Imaging AI Company to Publicly Release Comprehensive Classifier Performance Metrics

Industry-Leading Transparency Directly Addresses ACVR + ECVDI Concerns, Invites Independent Studies

]JANUARY 12, 2026 — SAN DIEGO, CA — Vetology Innovations today announced the public release of complete performance metrics for all 89+ classifiers across its diagnostic platform, making it the first and only AI company in the veterinary imaging space to provide this level of transparency.

The move is an acknowledgement of the recommendations in the American College of Veterinary Radiology (ACVR) and European College of Veterinary Diagnostic Imaging (ECVDI) position statement that identified “a key challenge” in veterinary AI: “the lack of transparency and validation for AI tools currently available for veterinary diagnostic imaging.”

The joint ACVR – ECVDI statement concluded: “There is currently no commercially available product for diagnostic imaging that meets these standards” [for transparency, validation, and safety].

“We’re changing that,” said Eric Goldman, President of Vetology. “Complete transparency isn’t a competitive advantage we’re protecting, it’s a professional obligation we’re fulfilling.”

What's Now Public

Available on Vetology’s website, the data includes condition-level sensitivity, specificity, and sample sizes across 300,000 test cases covering Vetology’s canine thorax, canine abdomen, feline thorax, feline abdomen, and spine/musculoskeletal condition classifiers.

The data includes both high performers, like the heart failure classifier with 89.5% sensitivity across 10,951 cases, and more challenging applications where AI-generated screening results serve as a decision support tool within a veterinarian-led diagnostic process, requiring professional expertise and domain knowledge to interpret and validate findings.

Why This Matters

For Researchers: Vetology welcomes collaboration with the research community as part of a shared commitment to evidence-based AI in veterinary medicine. We have partnered with institutions such as AMC New York and Tufts University (among others) on peer-reviewed studies.

Building on this foundation, Vetology invites researchers to engage with us on independent validation efforts, access additional performance data, or propose collaborative studies that advance transparency, rigor, and clinically meaningful evaluation.

For Board-Certified Radiologists: Vetology is inviting radiologists to work alongside us in shaping the future of veterinary AI imaging. As these tools become more integrated into clinical workflows, radiologist expertise is essential to helping define the guardrails, best practices, and professional standards that ensure AI supports, rather than distorts, patient care.

Through collaboration around transparent performance data, radiologists can help clarify where AI aligns with real-world clinical needs, where limitations remain, and what benchmarks the profession should expect from all vendors. This partnership is about collectively defining what “good enough” means in practice, strengthening industry-wide transparency, and establishing validation approaches that protect veterinarians and the animals they serve.

For General Practitioners: Vetology views general practitioners as essential partners in the responsible use of AI at the point of care. Transparent, classifier-specific performance data supports informed clinical judgment, by helping veterinarians understand where AI can meaningfully assist, where additional scrutiny is warranted, and how uncertainty should be factored into decision-making.

This shared responsibility encourages appropriate confidence without over-reliance. It reinforces professional judgment while supporting better, more consistent care for patients, and clearer communication with pet owners. Trust your training: AI can inform the veterinarian, but it cannot replace medical insight and domain knowledge.

For Regulatory Bodies: Vetology supports collaboration with regulators in developing thoughtful, evidence-based approaches to AI oversight. Publicly available performance data provides the empirical foundation needed to move beyond one-size-fits-all regulation and toward standards that reflect real differences across conditions, modalities, and clinical use cases. By working together, regulators, clinicians, and developers can help ensure imaging AI governance evolves in a way that protects patients, supports veterinary professionals, and aligns with the nuanced oversight long advocated by leaders such as the ACVR and ECVDI.

Beyond Academic Interest: Clinical Integration That Works

“We’re releasing our performance data so veterinarians can make confident decisions in everyday practice, and so the industry can move forward in establishing clear best practices and gold standards for AI in veterinary imaging,” said Cory Clemmons, Chief Technical Officer. “Transparency is how we build trust today, and a better future for patient care.”

Practical applications include:

    • Risk-stratified triage: High-sensitivity classifiers enable confident rule-outs in screening scenarios, while moderate-sensitivity classifiers signal when additional imaging or specialist consultation adds value.
    • Workflow optimization: High-confidence AI results help identify straightforward cases that may not require additional specialist review, while borderline or complex findings signal when radiologist consultation adds meaningful diagnostic value, enabling veterinary teams to allocate incremental diagnostic expenditures where they matter most for patient care.

Addressing Good Machine Learning Practice

The joint ACVR – ECVDI position statement emphasizes development “in accordance with good machine learning practices,” with particular focus on transparency, error reporting, and clinical expert involvement.

Vetology’s public metrics directly support these principles by enabling third-party evaluation, benchmarking against radiologist agreement rates, and providing visibility into both false positive and false negative characteristics through publicly reported sensitivity and specificity.

A Call to the Industry

“Every imaging AI company in this space will eventually publish performance data, either voluntarily or when regulators require it,” Goldman said. “We’re choosing to lead because transparency accelerates trust, and trust accelerates adoption of tools that genuinely help patients and practitioners.”

Vetology hopes this action encourages industry-wide adoption of open validation practices and provides a template for the kind of disclosure the ACVR and ECVDI explicitly urged.

What's Next

Vetology will update performance metrics as classifiers are retested, and publish the same comprehensive data for every new classifier launched, with new releases planned monthly. The company welcomes collaboration with academic institutions, regulatory bodies, and practicing veterinarians to refine validation methodologies and establish industry-wide standards.


# # #

ABOUT VETOLOGY

Vetology is a veterinary imaging support company that provides AI-generated radiology reports and traditional teleradiology services by board-certified veterinary radiologists. Built by radiologists, Vetology focuses on improving patient outcomes through accuracy, speed, and reliability in diagnostic imaging. Our platform is designed to integrate seamlessly into existing hospital workflows, helping clinicians make informed decisions quickly. Learn more at vetology.net.

Media Contacts

Thanks for reading! If you’d like to learn more or have any questions, we’d love to hear from you.

Vetology Strengthens Leadership Team with New Director of Sales

Vetology’s Connection with CoVet to Streamline Veterinary Radiology Workflows

FOR IMMEDIATE RELEASE

New connection enables seamless transfer of visit notes into teleradiology requests, reducing friction and improving diagnostic context for veterinary teams

Jan. 7, 2026 – CoVet, the leading veterinary AI copilot, has announced a new connection with Vetology, a trusted global provider of veterinary teleradiology services. The integration is designed to simplify and accelerate radiology workflows by allowing clinics to send CoVet visit notes directly into Vetology teleradiology requests.
For clinics that frequently rely on Vetology for imaging interpretations, this eliminates the need to manually copy, paste, or recreate patient medical histories when submitting cases. By reducing administrative steps, veterinary teams can focus more time on patient care while ensuring radiologists receive complete and accurate clinical context.

“Radiology interpretations are enhanced by the clinical information that accompanies them,” said Yannick, CTO, CoVet. “By connecting directly with Vetology, we are removing friction from the workflow and helping veterinary teams share clear, complete medical histories without extra effort. This is about fewer clicks, better continuity, and faster decision-making for busy clinics.”

“Strong partnerships lift everyone,” said Eric Goldman, President of Vetology. “Investing in software to improve team efficiency shouldn’t mean adding more manual steps to the texprocess. Integrating SOAP notes directly into teleradiology report orders streamlines workflow and eliminates repetitive tasks, exactly what true efficiency is about. The best systems automate repetitive tasks so veterinary teams can stay focused on their patients”

By combining CoVet’s ambient recording documentation with Vetology’s expert teleradiology services, the connection strengthens continuity of care and improves diagnostic efficiency. Clinics benefit from faster case submissions, reduced administrative burden, and improved collaboration with radiology specialists.

Ultimately, this partnership supports better clinical outcomes by ensuring radiologists receive comprehensive patient histories and helping veterinary teams move through their workflows more quickly and with greater confidence.

# # #

CoVet Logo

ABOUT CoVet

CoVet is an AI-powered clinical copilot built by veterinary professionals, for veterinary professionals. Designed to reduce administrative burden and prevent burnout, CoVet automates SOAP notes, transcribes consultations, and streamlines client communication, saving clinics over two hours per veterinarian, per day. Trusted by thousands of users across six continents, CoVet helps veterinary teams reclaim their time and refocus on what matters most: exceptional patient care. Learn more at www.co.vet

ABOUT VETOLOGY

Vetology is a veterinary imaging support company that provides AI-generated radiology reports and traditional teleradiology services by board-certified veterinary radiologists. Built by radiologists, Vetology focuses on improving patient outcomes through accuracy, speed, and reliability in diagnostic imaging. Our platform is designed to integrate seamlessly into existing hospital and radiologist workflows, helping clinicians make informed decisions quickly. Learn more at vetology.net.

Media Contacts

Thanks for reading! If you’d like to learn more or have any questions, we’d love to hear from you.

Pin It on Pinterest